
 ★
Make a Line Plot With Fractions
Grade 5 Math Worksheet

NameDate
Draw an X above the line for each measurement in the list.
Juice in each glass (cups): 1, , 1, 1, 1, , 1, .
Length of each pencil (inches): , , , , , , , , , .
 PencilGo
Grade 5 · Math · Data
When it’s done, scan the sheet with your phone and PencilGo marks it and picks the next one. Create a free account
We’ll email one free Grade 5 worksheet every school day. Your child does it on paper. No account needed.
Grade 5 Math Worksheet
Draw an X above the line for each measurement in the list.
Juice in each glass (cups): 1, , 1, 1, 1, , 1, .
Length of each pencil (inches): , , , , , , , , , .
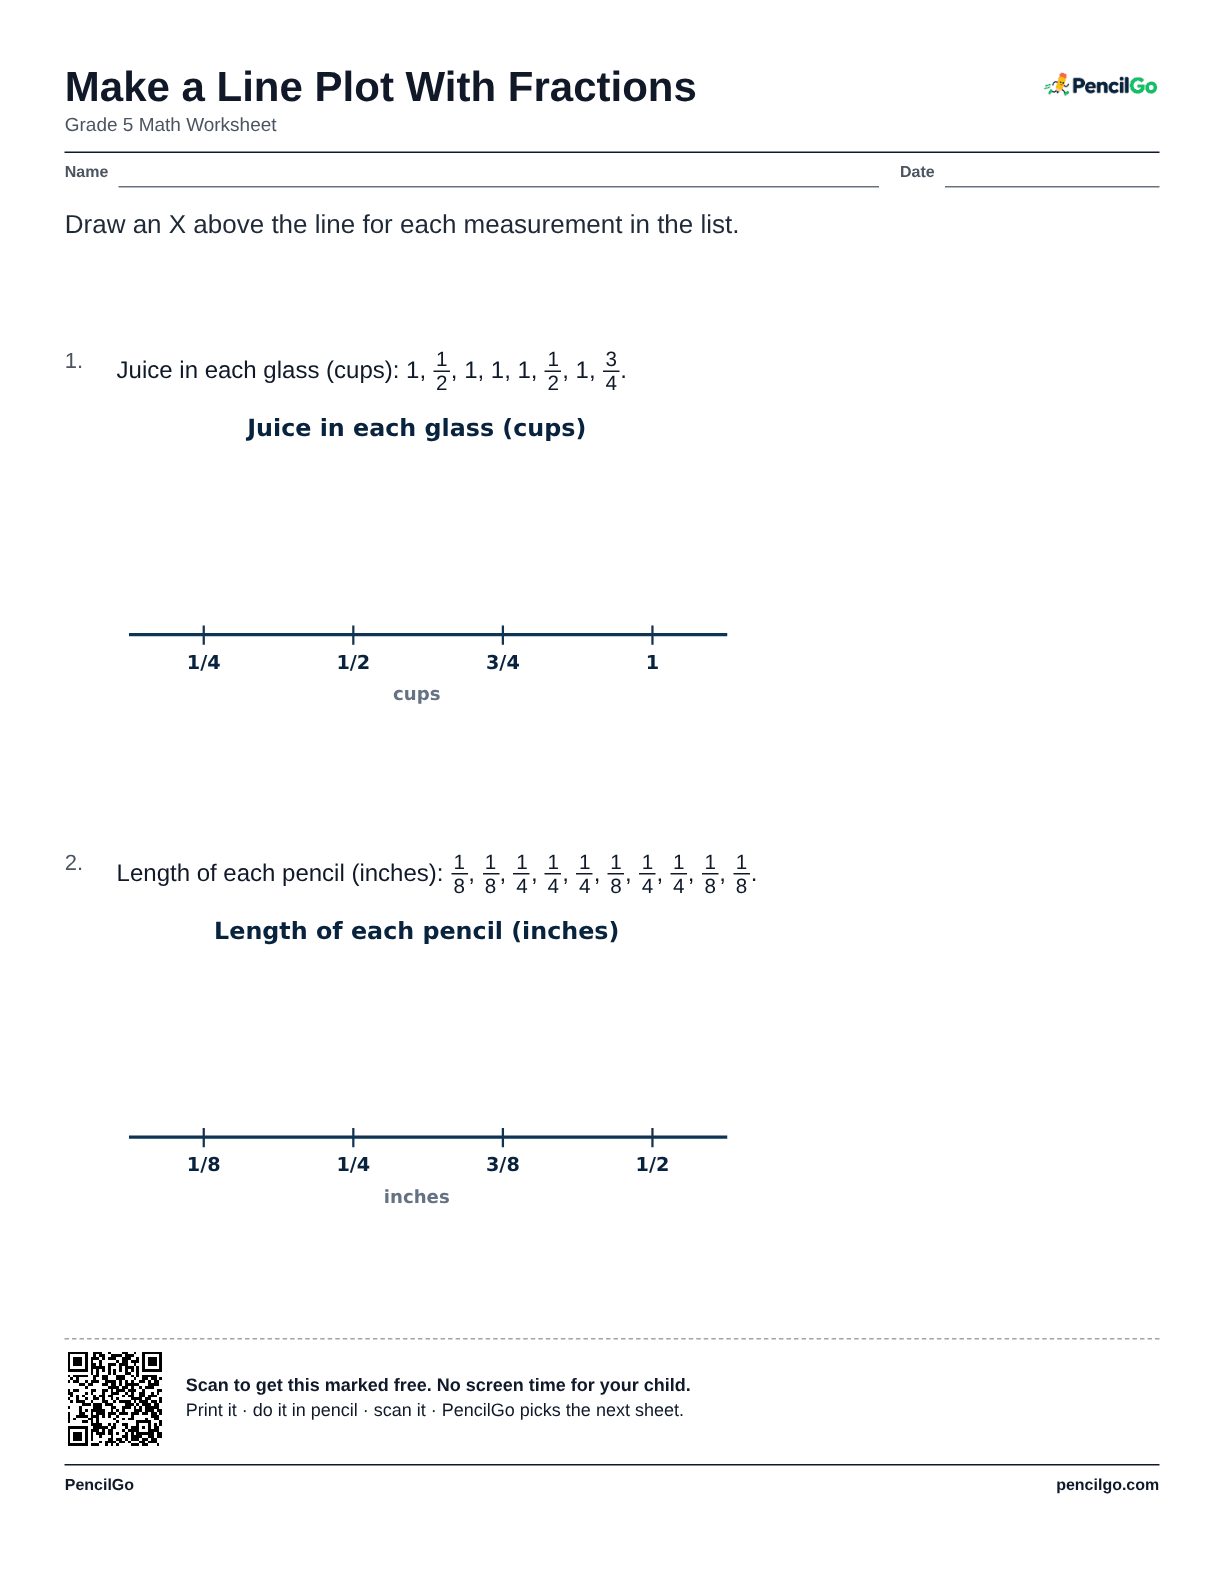
A line plot shows data on a number line: every measurement gets one X above its place on the line, and the X marks stack up where several measurements are the same. With fractions, the line is marked in halves, quarters or eighths. On this fifth grade sheet a child reads a list of eight to twelve measurements and draws the X marks on a blank line plot, one X for each measurement.
Each sheet has two plots. Each version has different data, and the answer key shows the X marks.
Common Core standard: 5.MD.B.2
If 1/4 appears 3 times in the list, draw 3 X marks stacked above 1/4.
Drawing one X for each different measurement instead of one for every measurement in the list.
Count how many times each measurement is in the list, then stack that many X marks above it.
Drawing one X for each different measurement instead of one for every measurement in the list.
Count how many times each measurement is in the list, then stack that many X marks above it.
Yes. All 6 printable versions on this page are free to download and print, with no account needed.
Similar: Read Bar Graphs · Make a Bar Graph
Every sheet you scan goes into your child’s record: dated, marked and ready for the year-end portfolio. Homeschool records