
 ★
Make a Bar Graph
Grade 5 Math Worksheet

NameDate
Draw each bar to the number shown in the list.
Favorite fruit: Apples 4, Pears 18, Grapes 12, Plums 20, Figs 8.
Pets at home: Dogs 20, Cats 16, Fish 6, Birds 14, Rabbits 10.
 PencilGo
Grade 5 · Math · Data
When it’s done, scan the sheet with your phone and PencilGo marks it and picks the next one. Create a free account
We’ll email one free Grade 5 worksheet every school day. Your child does it on paper. No account needed.
Grade 5 Math Worksheet
Draw each bar to the number shown in the list.
Favorite fruit: Apples 4, Pears 18, Grapes 12, Plums 20, Figs 8.
Pets at home: Dogs 20, Cats 16, Fish 6, Birds 14, Rabbits 10.
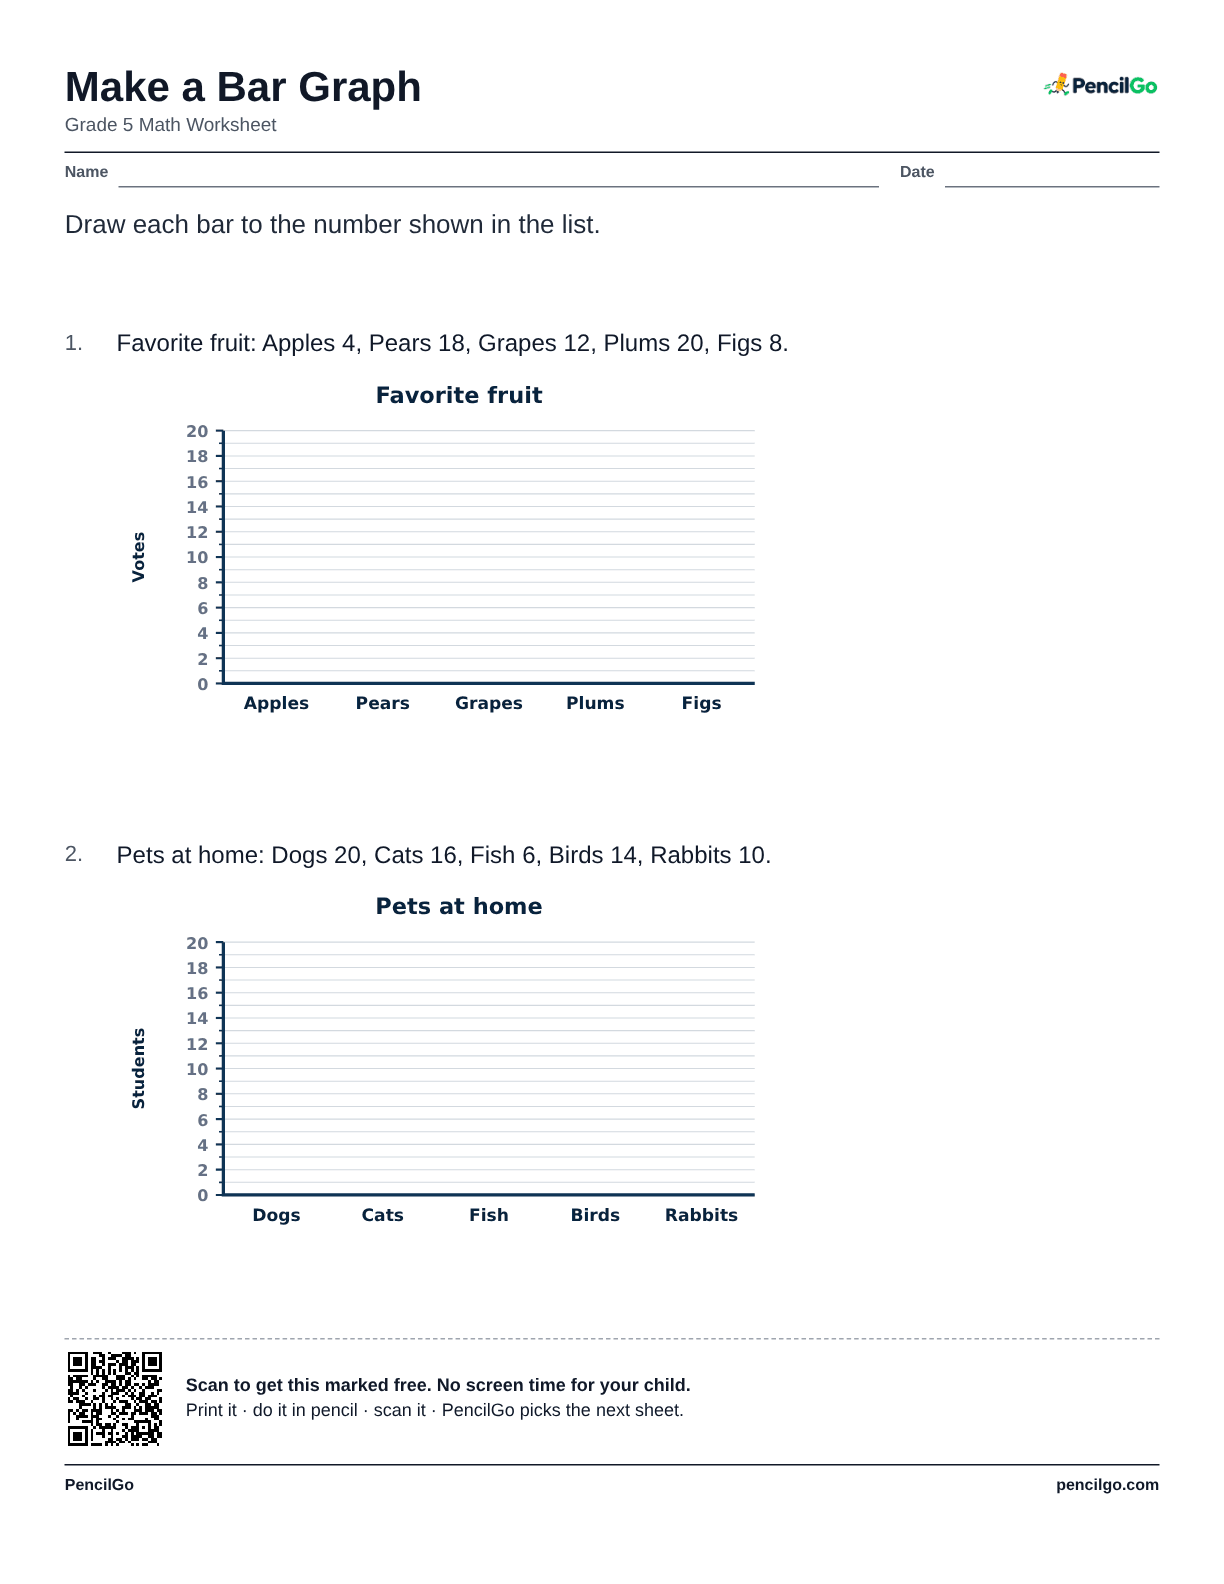
A bar graph compares amounts: each bar is as tall as the number it shows, read against the scale on the side. To draw a bar, find its category along the bottom, find its number on the scale, and color the bar up to that height. On this fifth grade sheet a child reads a list of five amounts and draws the five bars on a blank bar graph that already has its scale and its labels.
Each sheet has two graphs. Each version has different data, and the answer key shows the bars.
Common Core standard: 3.MD.B.3
If Apples has 12, color the bar above Apples up to the line at 12 on the scale.
Drawing a bar to the wrong line on the scale because the scale counts by 4 or 5 and not by 1.
Find the number on the side scale, go across to the bar, and color up to it.
Drawing a bar to the wrong line on the scale because the scale counts by 4 or 5 and not by 1.
Find the number on the side scale, go across to the bar, and color up to it.
Yes. All 6 printable versions on this page are free to download and print, with no account needed.
Similar: Read Bar Graphs · Make a Line Plot With Fractions
Every sheet you scan goes into your child’s record: dated, marked and ready for the year-end portfolio. Homeschool records