


PencilGo

Grade 5 · Math · Data

5th Grade Read Bar Graphs worksheets

6 printable versionsOn LevelAbout 5 minutes eachFree · no account

When it’s done, scan the sheet with your phone and PencilGo marks it and picks the next one. Create a free account

★
Version
Print

Read Bar Graphs

Grade 5 Math Worksheet

NameDate

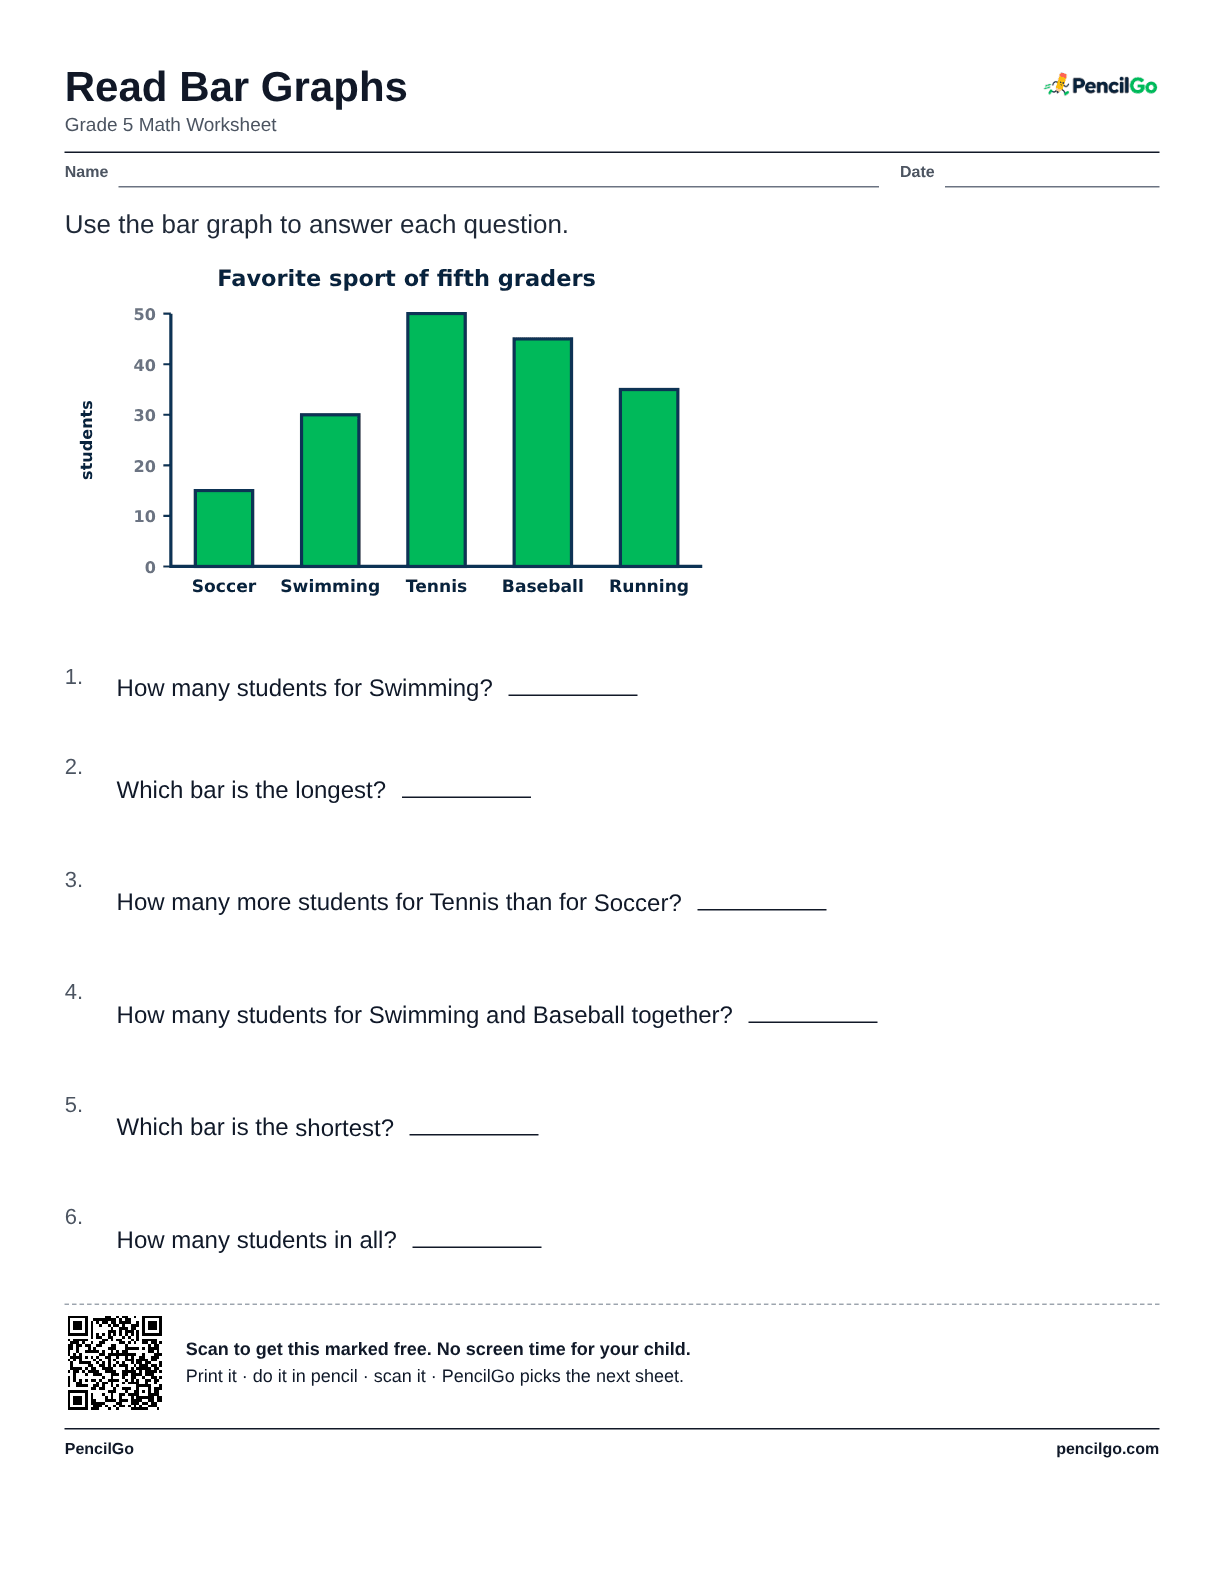
Use the bar graph to answer each question.

  1. How many students for Swimming?

  2. Which bar is the longest?

    Use the picture in question 1.

  3. How many more students for Tennis than for Soccer?

    Use the picture in question 1.

  4. How many students for Swimming and Baseball together?

    Use the picture in question 1.

  5. Which bar is the shortest?

    Use the picture in question 1.

  6. How many students in all?

    Use the picture in question 1.
PencilGopencilgo.com

5th Grade Read Bar Graphs worksheet 1 – printable PDF
Download PDF: 123456

About this worksheet

A bar graph shows how much there is of each thing with bars of different lengths, and reading it means finding where each bar ends on the number scale. On this fifth grade sheet one bar graph is printed once with five bars, and a child answers six questions about it: what one bar shows, which bar is the longest, how many more one is than another, and the total of two. Each version has a different graph about something children count, and the answer key gives every answer.

What your child will learn

  • Read a value from a bar
  • Find the most and the least
  • Find how many more or fewer
  • Add values from two bars

Common Core standard: 3.MD.B.3

Worked example

If the Soccer bar reaches 35 and the Tennis bar reaches 20, soccer has 35 \u2212 20 = 15 more.

Common mistake

Reading the number at the top of the nearest line instead of where the bar really ends.

Helpful hint

Follow the top of the bar across to the scale. For how many more, subtract the two values.

Questions parents ask

What is the most common mistake with read bar graphs?

Reading the number at the top of the nearest line instead of where the bar really ends.

How can I help my child with read bar graphs?

Follow the top of the bar across to the scale. For how many more, subtract the two values.

Are these 5th grade math worksheets free to print?

Yes. All 6 printable versions on this page are free to download and print, with no account needed.

Similar: Make a Line Plot With Fractions · Make a Bar Graph

More 5th grade data

See all data

Every sheet you scan goes into your child’s record: dated, marked and ready for the year-end portfolio. Homeschool records