PencilGo

Grade 3 · Science · Earth science

3rd Grade Weather Patterns worksheets

6 printable versionsChallenge MeAbout 12 minutes eachFree · no account

When it’s done, scan the sheet with your phone and PencilGo marks it and picks the next one. Create a free account

★
Version
Print

Weather Patterns

Grade 3 Science Worksheet - Challenge Me

NameDate

Circle the answer.

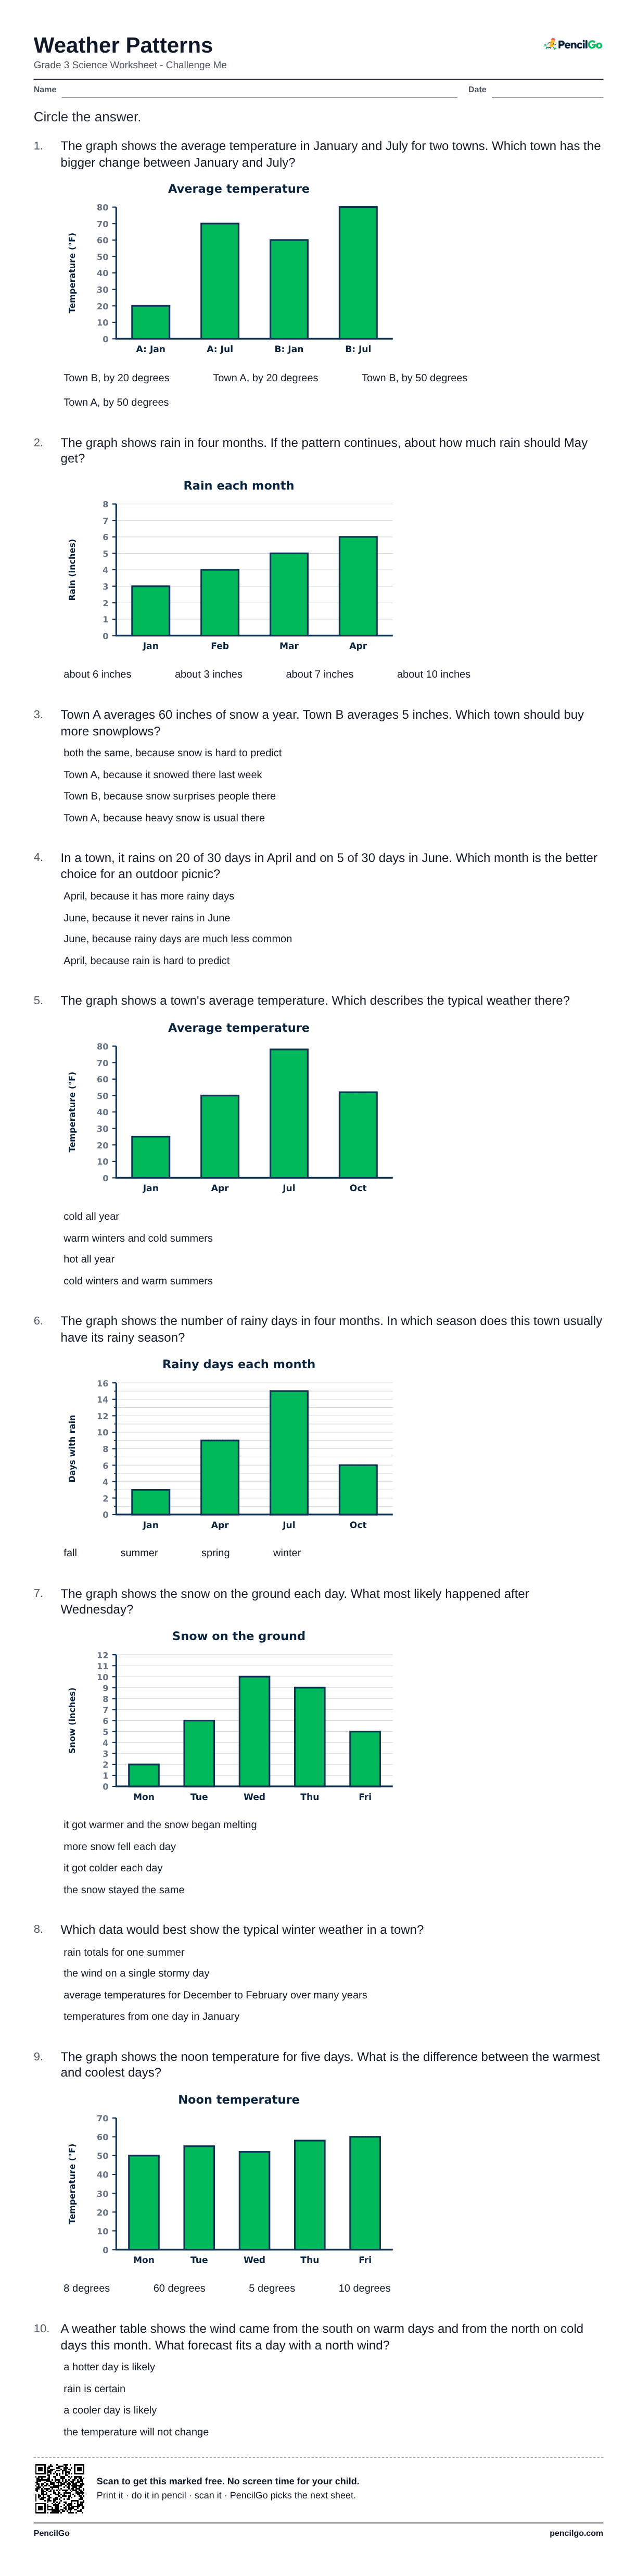
  1. The graph shows the average temperature in January and July for two towns. Which town has the bigger change between January and July?

    • Town B, by 20 degrees
    • Town A, by 20 degrees
    • Town B, by 50 degrees
    • Town A, by 50 degrees
  2. The graph shows rain in four months. If the pattern continues, about how much rain should May get?

    • about 6 inches
    • about 3 inches
    • about 7 inches
    • about 10 inches
  3. Town A averages 60 inches of snow a year. Town B averages 5 inches. Which town should buy more snowplows?

    • both the same, because snow is hard to predict
    • Town A, because it snowed there last week
    • Town B, because snow surprises people there
    • Town A, because heavy snow is usual there
  4. In a town, it rains on 20 of 30 days in April and on 5 of 30 days in June. Which month is the better choice for an outdoor picnic?

    • April, because it has more rainy days
    • June, because it never rains in June
    • June, because rainy days are much less common
    • April, because rain is hard to predict
  5. The graph shows a town's average temperature. Which describes the typical weather there?

    • cold all year
    • warm winters and cold summers
    • hot all year
    • cold winters and warm summers
  6. The graph shows the number of rainy days in four months. In which season does this town usually have its rainy season?

    • fall
    • summer
    • spring
    • winter
  7. The graph shows the snow on the ground each day. What most likely happened after Wednesday?

    • it got warmer and the snow began melting
    • more snow fell each day
    • it got colder each day
    • the snow stayed the same
  8. Which data would best show the typical winter weather in a town?

    • rain totals for one summer
    • the wind on a single stormy day
    • average temperatures for December to February over many years
    • temperatures from one day in January
  9. The graph shows the noon temperature for five days. What is the difference between the warmest and coolest days?

    • 8 degrees
    • 60 degrees
    • 5 degrees
    • 10 degrees
  10. A weather table shows the wind came from the south on warm days and from the north on cold days this month. What forecast fits a day with a north wind?

    • a hotter day is likely
    • rain is certain
    • a cooler day is likely
    • the temperature will not change
PencilGopencilgo.com

3rd Grade Weather Patterns worksheet 1 – printable PDF
Download PDF: 123456

About this worksheet

Weather patterns help students use data to describe typical weather and predict what comes next helps third graders connect observations with scientific explanations instead of memorizing isolated facts. Students may choose a forecast from one exciting day instead of looking across several observations for a repeated pattern. This worksheet uses short evidence-based situations so students must read the setup, identify the pattern, and choose the answer that fits the science idea named in the title. Students read weather graphs with units, compare towns and seasons, choose measurement tools, and support forecasts with patterns in the data.

Support versions use familiar examples and direct wording. Standard and challenge versions add closer distractors and require more comparison. Encourage your child to point to the evidence in the prompt before choosing an answer. If the answer does not explain the observation or solve the stated problem, it is probably a distractor. That habit builds careful science reasoning and prepares students for longer investigations.

What your child will learn

  • Read weather graphs
  • Identify patterns
  • Choose measurement tools
  • Support forecasts with evidence

NGSS standard: 3-ESS2-1

Worked example

If the noon temperature rises each day this week, the pattern supports a warmer forecast for tomorrow.

Common mistake

Basing a forecast on one data point instead of the pattern.

Helpful hint

Look across the data before predicting.

Questions parents ask

What is the most common mistake with weather patterns?

Basing a forecast on one data point instead of the pattern.

How can I help my child with weather patterns?

Look across the data before predicting.

Are these 3rd grade science worksheets free to print?

Yes. All 6 printable versions on this page are free to download and print, with no account needed.

Similar: Climates Around the World · Climate and Weather Hazards

More 3rd grade earth science

See all earth science

Every sheet you scan goes into your child’s record: dated, marked and ready for the year-end portfolio. Homeschool records