Is it a function? Vertical line test, and reading values from graphs and tables
Grade 9 Math Worksheet

Circle the best answer, or write your answer on the line.
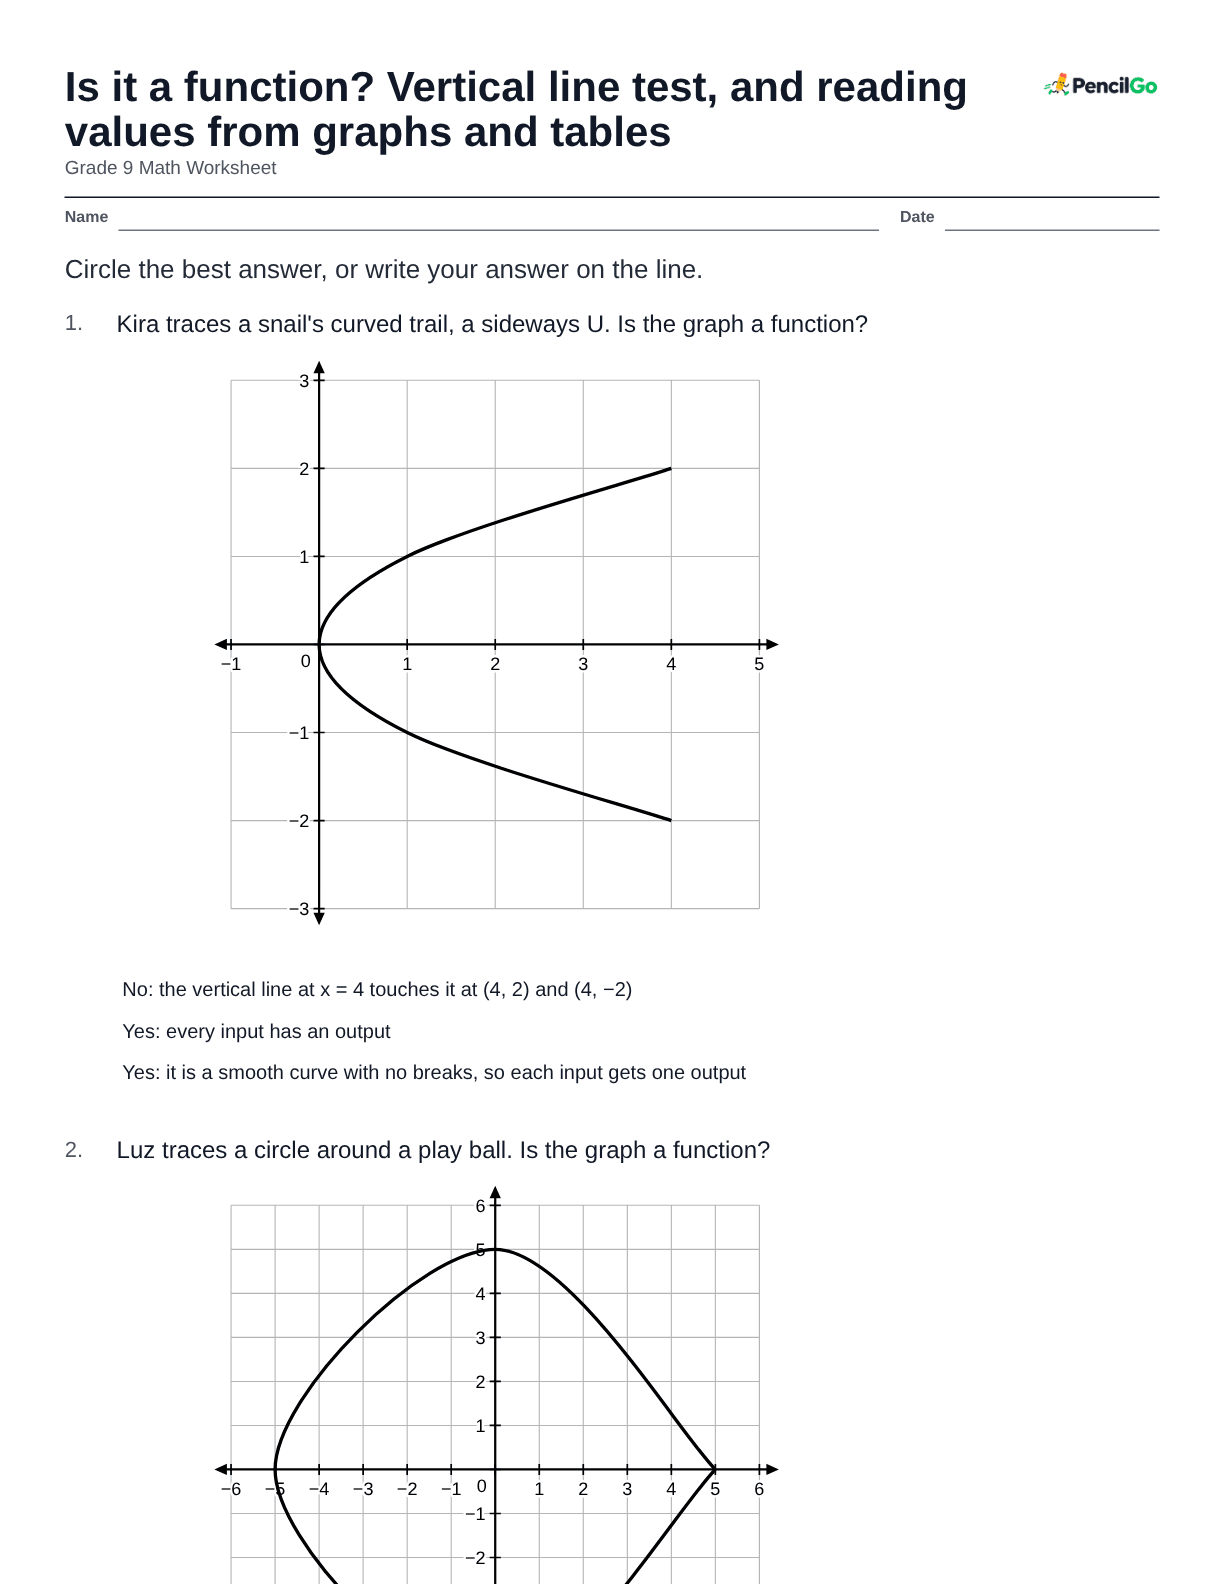
Kira traces a snail's curved trail, a sideways U. Is the graph a function?
- No: the vertical line at x = 4 touches it at (4, 2) and (4, −2)
- Yes: every input has an output
- Yes: it is a smooth curve with no breaks, so each input gets one output
Luz traces a circle around a play ball. Is the graph a function?
- Yes: every input from −5 to 5 has an output, so the graph is a function
- No: the vertical line at x = 0 touches it at (0, 5) and (0, −5)
- No: the horizontal line at y = 0 touches it twice
Noah's robot follows the relation x = y² (x is the input). Test x = 9. Is it a function?
- No: any equation with a square fails
- No: the input 9 gives y = 3 and y = −3
- Yes: the input 9 gives only y = 3 as its output
Pia's puzzle uses the relation y = x² (x is the input). Test x = 3 and x = −3. Is it a function?
- No: any equation with a square in it fails the function test
- No: the inputs 3 and −3 give the same output
- Yes: each input gives one output (3 and −3 both give 9)
Ren's timer follows the relation |y| = x (x is the input). Test x = 5. Is it a function?
- No: any equation with bars fails
- No: the input 5 gives y = 5 and y = −5
- Yes: the input 5 gives only y = 5
Tala's cat game uses the relation y = |x| (x is the input). Test x = 2 and x = −2. Is it a function?
- No: any equation with bars fails
- No: the inputs 2 and −2 give the same output
- Yes: each input gives one output (2 and −2 both give 2)
Bo plots a sneaker test. The graph shows f(x), a score. What is f(0)?
Esme's bell rings louder over time. The graph shows f(x). For which x is f(x) = 5?
Jun's hat test is plotted. The graph shows f(x). For which x is f(x) = 7?
Kira's scarf grows longer. The graph shows f(x). For which x is f(x) = 8?