
PencilGo

Grade 11 · Math · Precalculus

11th grade Binomial averages, the Central Limit Theorem and the normal curve worksheet

6 printable versionsBuilding Confidence10 questions · answer keyFree · no account

Level: Building Confidence · On Level · Challenge Me

When it’s done, scan the sheet with your phone and PencilGo marks it and picks the next one. Create a free account

Version
Print

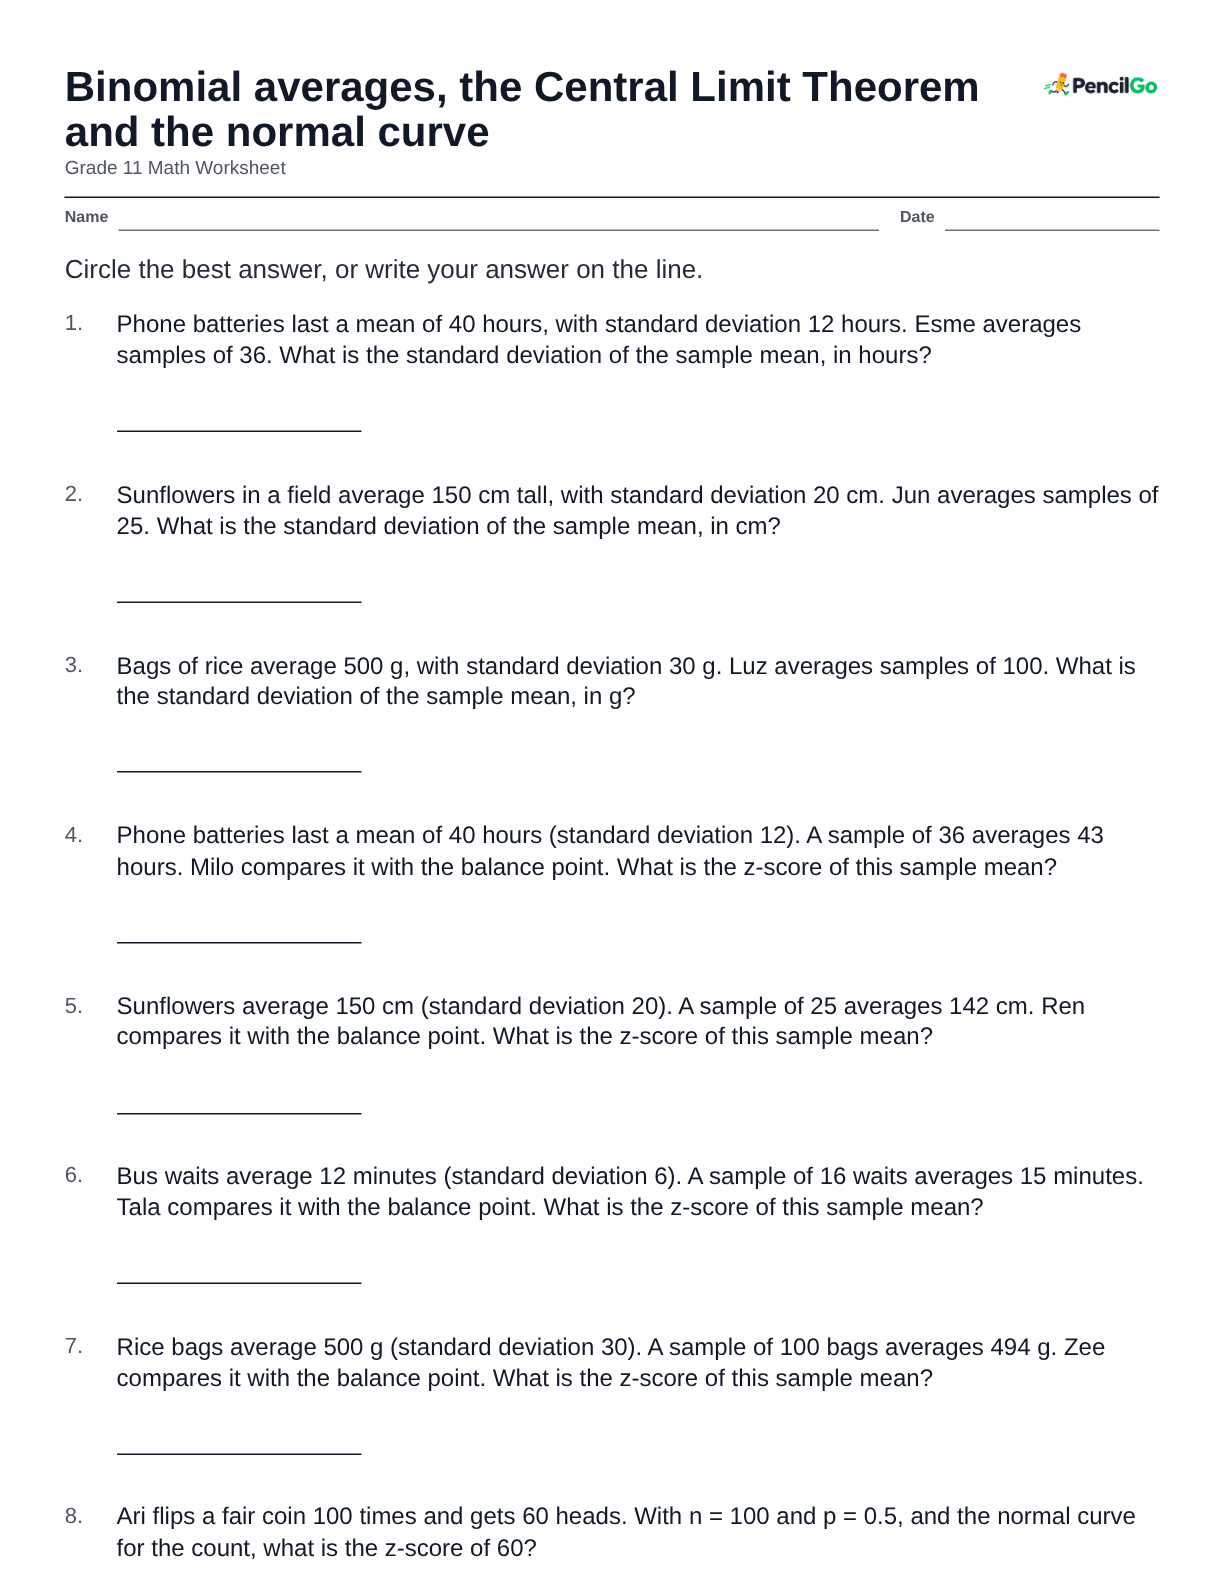
Binomial averages, the Central Limit Theorem and the normal curve

Grade 11 Math Worksheet - Building Confidence

NameDate

Circle the best answer, or write your answer on the line.

  1. 80% of bean seeds sprout. Bo plants 50 seeds. On average, how many should sprout?

  2. Jun's bus is on time 60% of school days. Over 30 school days, on average how many days is it on time?

  3. Kira flips a fair coin 100 times and counts heads. The count is binomial with n = 100 and p = 0.5. What is the variance of the count?

  4. Luz guesses on 64 true-false questions. The count is binomial with n = 64 and p = 0.5. What is the variance of the count?

  5. About 10% of Milo's school's 400 lockers stick. The count is binomial with n = 400 and p = 0.1. What is the variance of the count?

  6. One in five of 625 seed packets has a bonus seed, Ren reads. The count is binomial with n = 625 and p = 0.2. What is the variance of the count?

  7. Tala checks a crate of 100 apples; about 10% have a bruise. With n = 100 and p = 0.1, what is the standard deviation of the count?

  8. Zee's class flips 900 fair coins and counts heads. With n = 900 and p = 0.5, what is the standard deviation of the count?

  9. Ari rolls 144 number cubes and counts even results. With n = 144 and p = 0.5, what is the standard deviation of the count?

  10. Bo's club makes 400 kites; one in five gets a long tail. With n = 400 and p = 0.2, what is the standard deviation of the count?
PencilGopencilgo.com

11th grade Binomial averages, the Central Limit Theorem and the normal curve worksheet – printable
Print: 123456

About this worksheet

Binomial averages, the Central Limit Theorem and the normal curve. Every version has 10 questions, and the answer key prints on the second page.

What your child will learn

  • I can find the mean, variance and standard deviation of a binomial count.
  • I can find how much sample means spread and how big a sample needs to be.
  • I can use the normal curve for a binomial count: its z-score, its half-unit edge, and a tail chance from the 68–95–99.7 rule.

Standard: S-ID.A.4, S-MD.A.2 (+)

Words to know

binomial count: How many successes in n tries, each with the same chance p.

variance: The spread squared: n × p × (1 − p) for a binomial count.

standard deviation: The typical distance from the balance point; the square root of the variance.

sample mean: The average of one sample of n values.

Central Limit Theorem: Sample means pile into a bell shape with spread σ ÷ √n.

continuity correction: Moving the edge half a unit, because counts are whole numbers.

Common mistakes

Multiplied by the chance of the other outcome. Ask which outcome the question counts, then use its chance.

Used 70 for 70%. A percent is a part of 100, so 70% is 0.7.

Gave n × p, the mean, for the variance. The variance also multiplies by 1 − p.

Questions parents ask

What is the most common mistake with binomial averages, the central limit theorem and the normal curve?

Multiplied by the chance of the other outcome. Ask which outcome the question counts, then use its chance.

Are these 11th grade math worksheets free to print?

Yes. All 6 printable versions at each level are free to print, with the answer key, and no account is needed.

More precalculus

See all Precalculus

Every sheet you scan goes into your child’s record: dated, marked and ready for the year-end portfolio. Homeschool records