
PencilGo

Grade 9 · Science · Earth and Space Science

9th grade Climate change: the measurements and the models worksheet

6 printable versionsOn Level10 questions · answer keyFree · no account

Level: Building Confidence · On Level · Challenge Me

When it’s done, scan the sheet with your phone and PencilGo marks it and picks the next one. Create a free account

Version
Print

Climate change: the measurements and the models

Grade 9 Science Worksheet

NameDate

Circle the best answer.

  1. Read this first

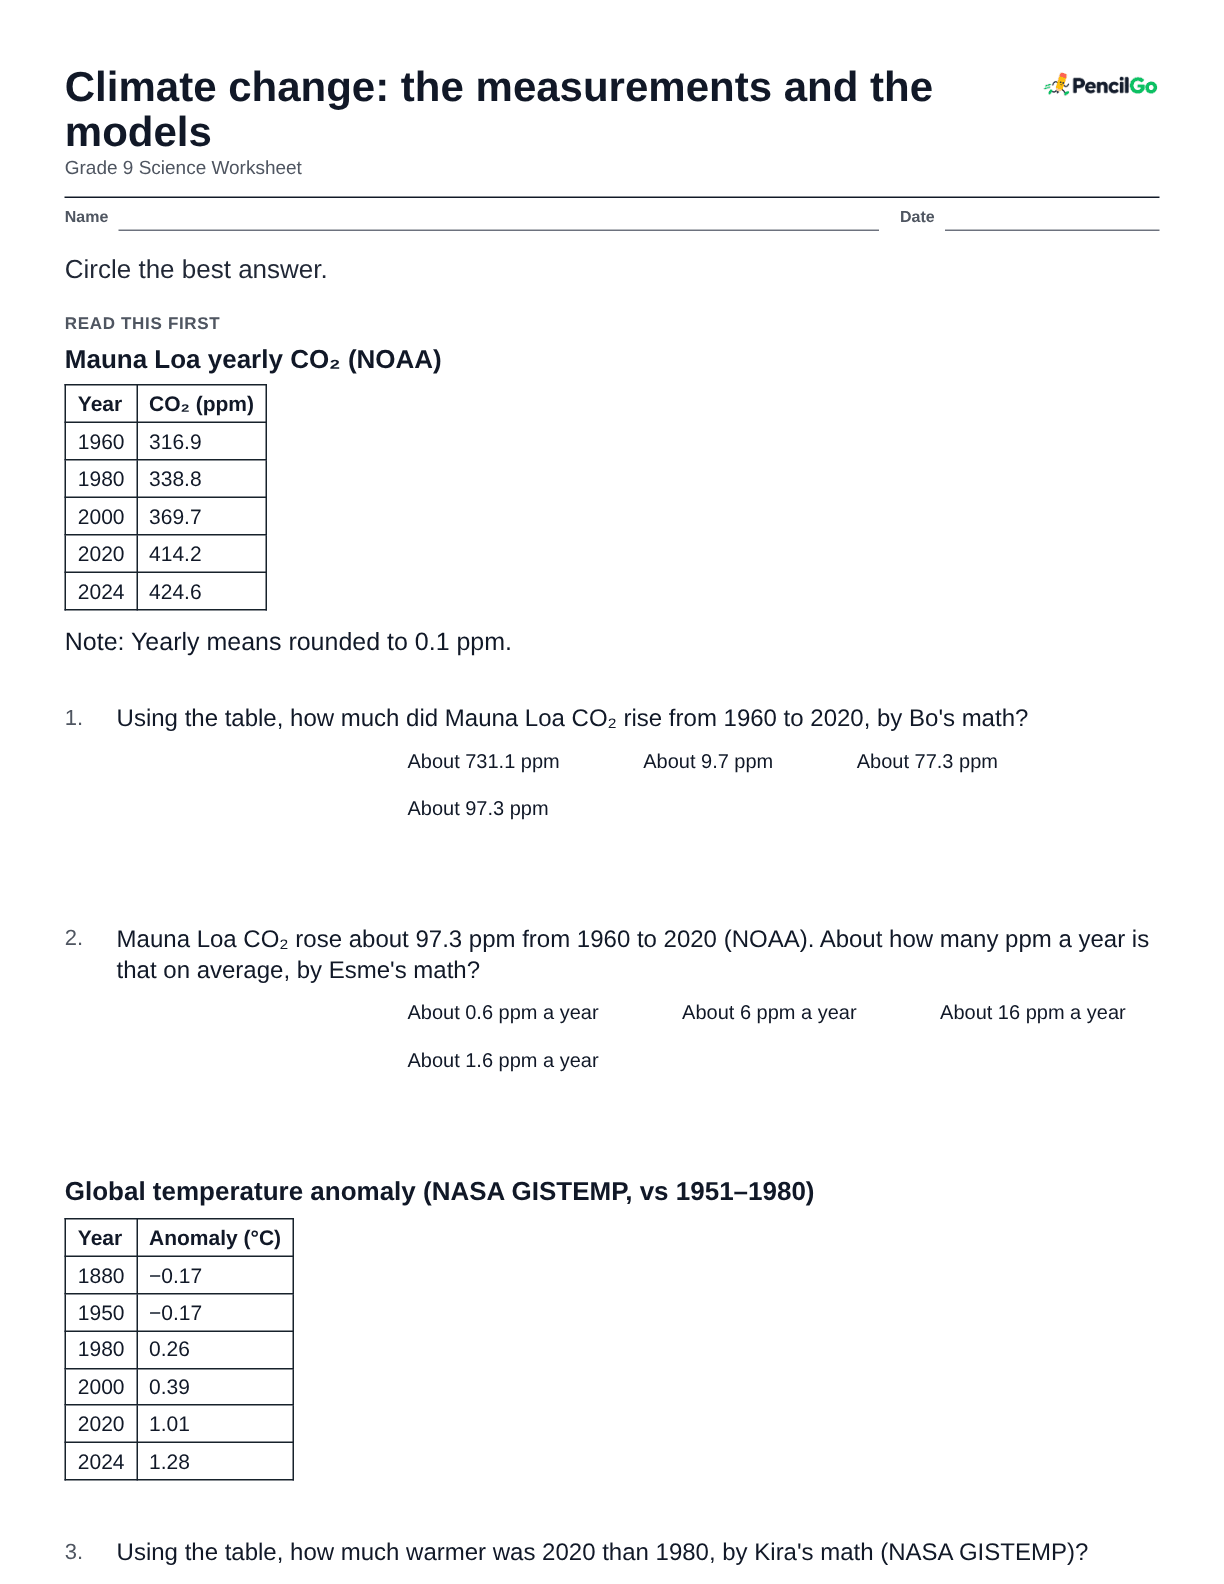
    Mauna Loa yearly CO₂ (NOAA)

    YearCO₂ (ppm)
    1960316.9
    1980338.8
    2000369.7
    2020414.2
    2024424.6

    Note: Yearly means rounded to 0.1 ppm.

  2. Using the table, how much did Mauna Loa CO₂ rise from 1960 to 2020, by Bo's math?

    • About 731.1 ppm
    • About 9.7 ppm
    • About 77.3 ppm
    • About 97.3 ppm
  3. Mauna Loa CO₂ rose about 97.3 ppm from 1960 to 2020 (NOAA). About how many ppm a year is that on average, by Esme's math?

    • About 0.6 ppm a year
    • About 6 ppm a year
    • About 16 ppm a year
    • About 1.6 ppm a year
  4. Global temperature anomaly (NASA GISTEMP, vs 1951–1980)

    YearAnomaly (°C)
    1880−0.17
    1950−0.17
    19800.26
    20000.39
    20201.01
    20241.28
  5. Using the table, how much warmer was 2020 than 1980, by Kira's math (NASA GISTEMP)?

    • About 0.26 °C
    • About 0.75 °C
    • About 7.5 °C
    • About 1.27 °C
  6. Using the table, about how fast did temperature rise from 1980 to 2020, in °C per decade, by Luz's math?

    • About 0.02 °C per decade
    • About 0.75 °C per decade
    • About 1.9 °C per decade
    • About 0.19 °C per decade
  7. Using the table, how much warmer was 2024 than 1880, by Milo's math?

    • About 0.17 °C
    • About 1.11 °C
    • About 1.28 °C
    • About 1.45 °C
  8. IPCC AR6 calls human influence the main driver of a change. What does 'main driver' mean there, by Noah's reading?

    • Responsible for more than 50% of the change
    • A possible cause that has been ruled out
    • Responsible for less than 10% of the change
    • Responsible for 100% of it, with nothing else at work
  9. IPCC AR6: what caused the rise in well-mixed greenhouse gases since around 1750, by Pia's reading?

    Use the picture in question 6.

    • Changes in the Sun, mainly
    • Volcanoes, mainly
    • Human activities, unequivocally
    • Ocean waves releasing gas
  10. Projected warming in 2081–2100 vs 1850–1900 (IPCC AR6)

    ScenarioBest estimate (°C)Very likely range (°C)
    SSP1-1.9 (very low emissions)1.41.0 to 1.8
    SSP1-2.6 (low)1.81.3 to 2.4
    SSP2-4.5 (intermediate)2.72.1 to 3.5
    SSP3-7.0 (high)3.62.8 to 4.6
    SSP5-8.5 (very high)4.43.3 to 5.7

    Note: Projections, not measurements.

  11. Using the table, how many times as wide is the SSP5-8.5 range as the SSP1-1.9 range, by Tala's math?

    • No wider; each scenario has one exact value
    • 2 times as wide
    • 1.6 times as wide
    • 3 times as wide
  12. Using the table, how much more warming is the SSP5-8.5 best estimate than the SSP1-1.9 one, by Zee's math?

    • About 1.4 °C
    • About 0.3 °C
    • About 5.8 °C
    • About 3.0 °C
  13. Why do IPCC projections differ from one scenario to the next, by Ari's reading?

    • One warm year decides which scenario comes true
    • Scenarios are guesses that set the laws of physics aside
    • Each scenario assumes a different path of future emissions
    • Each scenario uses a different record of past temperatures
PencilGopencilgo.com

9th grade Climate change: the measurements and the models worksheet – printable
Print: 123456

About this worksheet

Read climate measurements and model projections. Every version has 10 questions, and the answer key prints on the second page.

What your child will learn

  • I can read the Mauna Loa CO₂ record and the NASA temperature anomaly record, and compute changes and rates per year or per decade.
  • I can state the IPCC AR6 finding: it is unequivocal that human influence has warmed the atmosphere, ocean and land, with natural drivers near zero.
  • I can read a projection as a model result for a named emissions scenario with a range, not a measurement or a single number.

Standard: HS-ESS3-5

Words to know

anomaly: A difference from an average, like 1.28 °C above 1951–1980

ppm: Parts per million: CO₂ molecules per million air molecules

trend: The long-run change across decades, not one year

main driver: IPCC: responsible for more than 50% of a change

scenario: An assumed path of future emissions, like SSP2-4.5

projection: A model estimate of the future under one scenario, with a range

Common mistakes

Your child read an anomaly as a temperature. NASA GISTEMP values are differences from the 1951–1980 average; a negative value means cooler than that average.

Your child judged the trend from one year or one season. NOAA measures trends over decades: about 0.06 °C per decade since 1850 and 0.20 °C since 1982.

Your child misnamed the main cause. IPCC AR6: it is unequivocal that human influence has warmed the atmosphere, ocean and land; natural drivers changed temperature by −0.1 to +0.1 °C.

Questions parents ask

What is the most common mistake with climate change: the measurements and the models?

Your child read an anomaly as a temperature. NASA GISTEMP values are differences from the 1951–1980 average; a negative value means cooler than that average.

Are these 9th grade science worksheets free to print?

Yes. All 6 printable versions at each level are free to print, with the answer key, and no account is needed.

More earth and space science

See all Earth and Space Science

Every sheet you scan goes into your child’s record: dated, marked and ready for the year-end portfolio. Homeschool records