Probability distributions, expected value, and the spread of a random variable
Grade 11 Math Worksheet

Circle the best answer, or write your answer on the line.
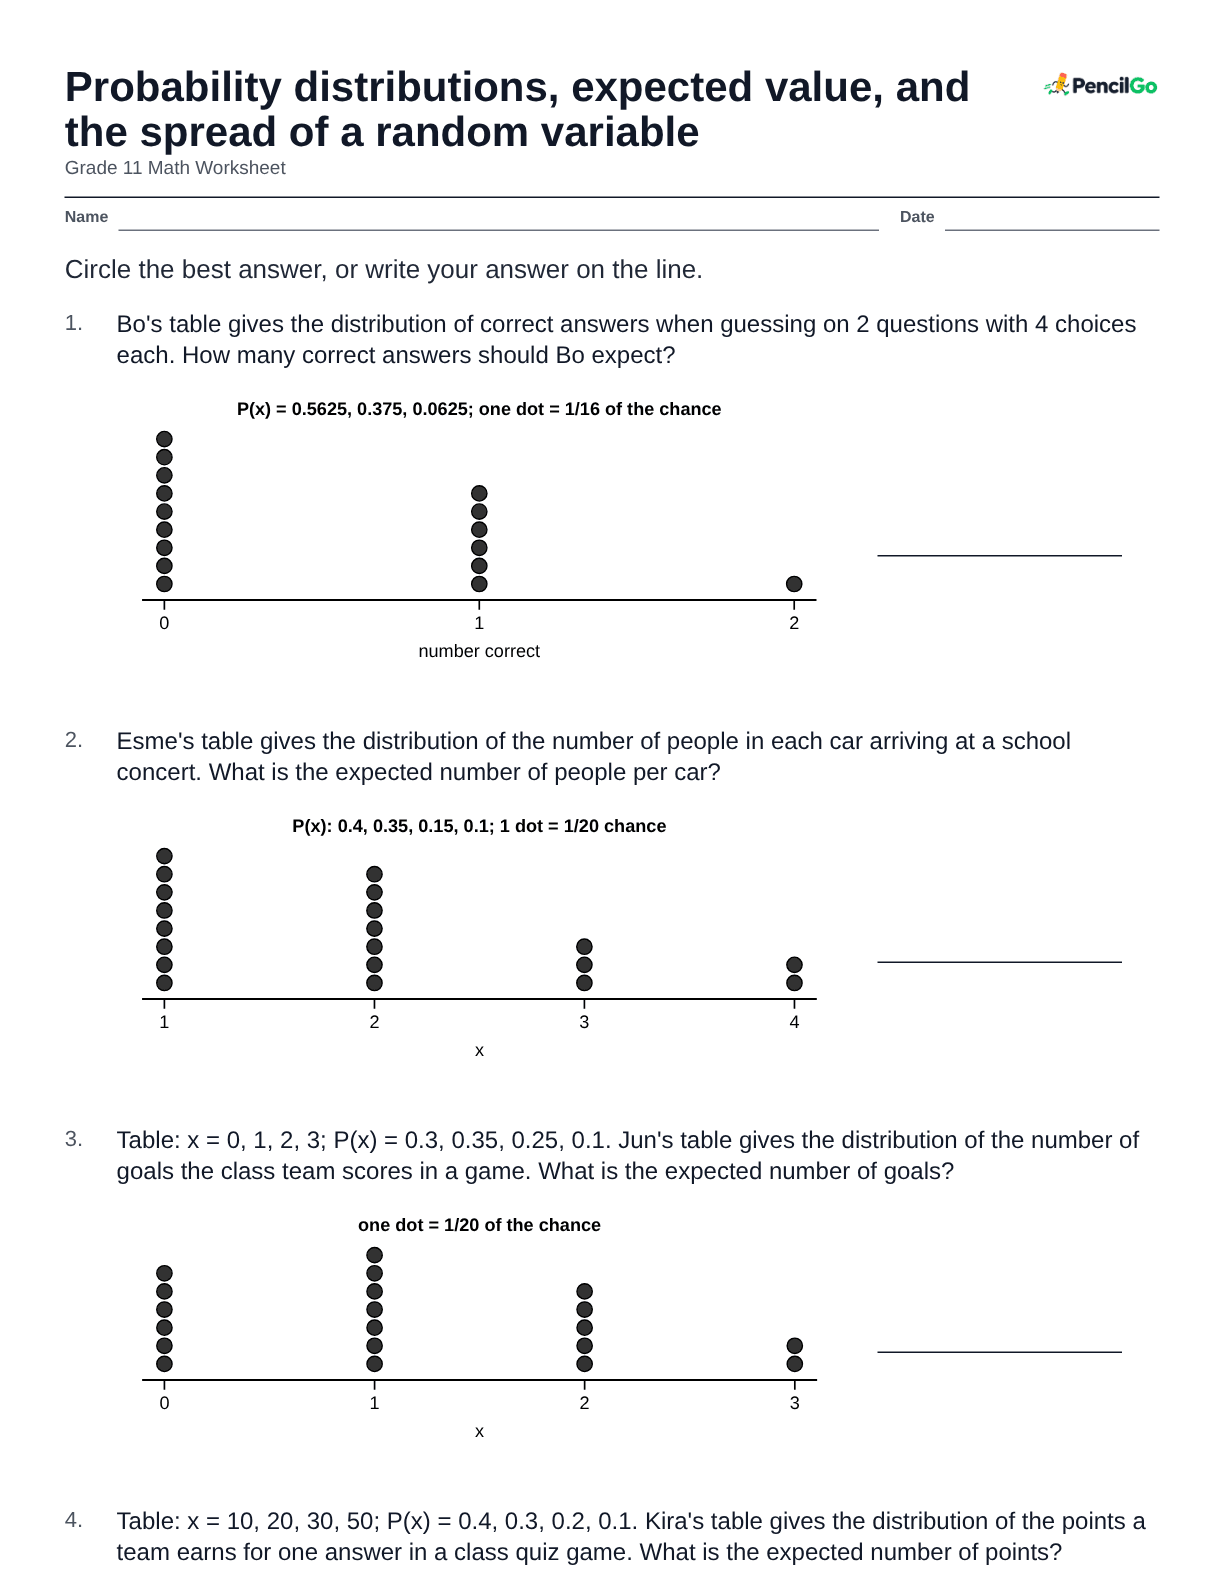
Bo's table gives the distribution of correct answers when guessing on 2 questions with 4 choices each. How many correct answers should Bo expect?
Esme's table gives the distribution of the number of people in each car arriving at a school concert. What is the expected number of people per car?
Table: x = 0, 1, 2, 3; P(x) = 0.3, 0.35, 0.25, 0.1. Jun's table gives the distribution of the number of goals the class team scores in a game. What is the expected number of goals?
Table: x = 10, 20, 30, 50; P(x) = 0.4, 0.3, 0.2, 0.1. Kira's table gives the distribution of the points a team earns for one answer in a class quiz game. What is the expected number of points?
Luz writes four lists of chances for the number of rainy days in a 3-day class trip, for x = 0, 1, 2, 3. Which list can be a probability distribution?
- P = 0.3, 0.4, 0.2, 0.1
- P = 0.6, 1.2, -0.4, -0.4
- P = 0.4, 0.3, 0.3, 0.1
- P = 0.5, 0.4, 0.2, -0.1
Milo writes four lists of chances for the number of puzzles a club solves in an hour, for x = 0, 1, 2, 3. Which list can be a probability distribution?
- P = 0.2, 0.3, 0.25, 0.15
- P = 0.25, 0.25, 0.25, 0.35
- P = 0.25, 0.25, 0.35, 0.15
- P = 0.45, -0.05, 0.35, 0.25
Noah writes four lists of chances for the number of kites in the air at the park, for x = 0, 1, 2, 3. Which list can be a probability distribution?
- P = 0.15, 0.45, 0.3, 0.2
- P = 1, 1, 1, 1
- P = 0.05, 0.45, 0.3, 0.2
- P = -0.2, 0.6, 0.4, 0.2
Pia writes four lists of chances for the number of shells found on a beach walk, for x = 0, 1, 2, 3. Which list can be a probability distribution?
- P = 0.1, 0.5, 0.25, 0.05
- P = 0.25, 0.25, 0.25, 0.2
- P = 0.1, 0.6, 0.25, 0.05
- P = 0.1, 0.7, 0.25, -0.05
Tala records the class team's goals in each of 20 games. What is the mean number of goals per game?
Read this first
Use this
Table: tries = 1, 2, 3, 4, 5, 6; number of times = 4, 6, 5, 3, 1, 1 (20 in all).
Ari counts the tries each of 20 students needs to fly a kite. What is the mean number of tries per student?