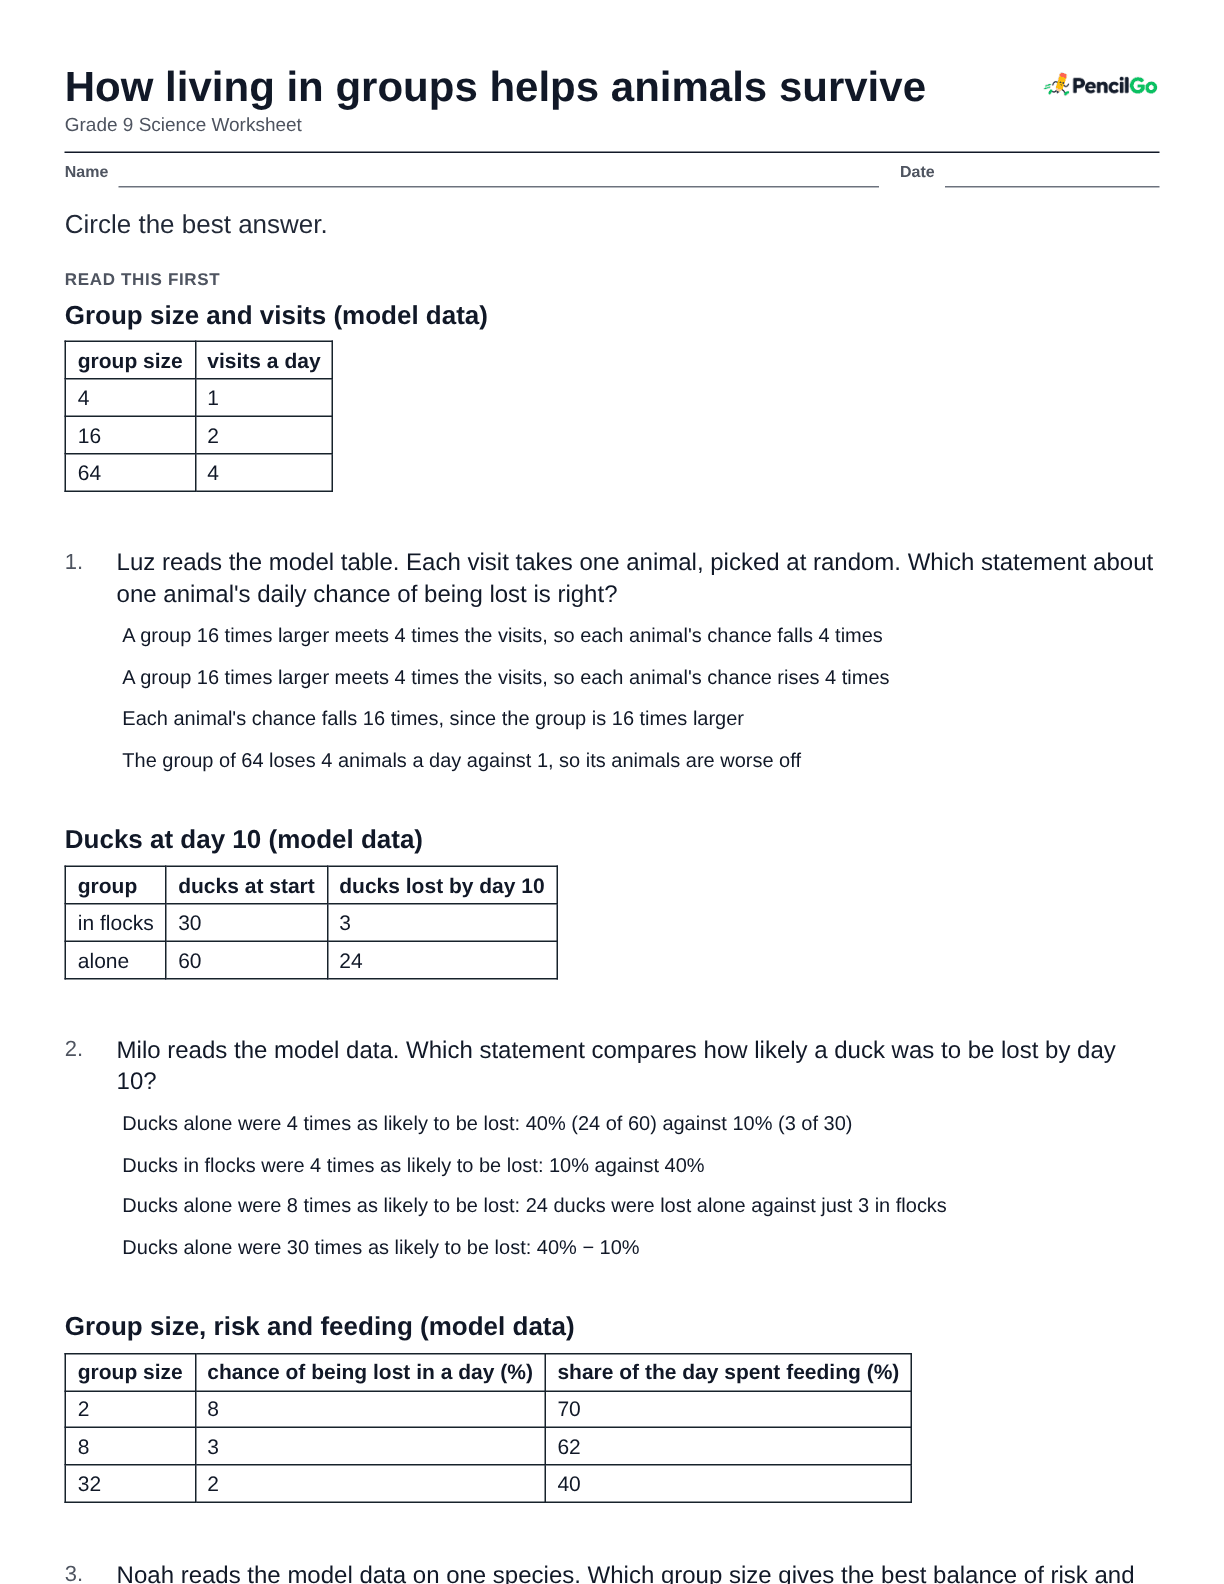
How living in groups helps animals survive
Grade 9 Science Worksheet - Building Confidence

Circle the best answer.
Read this first
Two minnow schools (model data)
school minnows visits a day minnows lost per visit school X 10 2 1 school Y 40 2 1 Ari reads the model card. Each visit takes one minnow, picked at random. Which statement compares one minnow's chance of being lost in a day?
- The same in both: each school loses 2 minnows a day
- Higher in school Y: 40 minnows make a bigger target for each visit
- Lower in school Y: 2 of 40 is 5%, against 2 of 10, or 20%, in school X
- Lower in school Y, since a bigger school finds more food
Flocks of different sizes (model data)
flock size seconds one bird scans per minute seconds until the flock spots a threat 1 40 12 4 30 6 16 20 3 Bo reads model data on flocks. Which statement does the table support?
- Each bird scans more in a bigger flock, since more birds share the work
- Each bird scans less in a bigger flock, yet the flock spots a threat sooner
- A bigger flock spots a threat later, since each bird scans fewer seconds in a minute
- Flock size changes how much food the birds find, not the scanning
Jun reads the graph. During which days did the alone minnows fall fastest, and by how many?
- Days 5 to 6: the alone line ends at 9, its lowest point
- Days 0 to 1: the alone line falls from 20 to 16, a loss of 4 minnows
- Days 1 to 2: the alone line falls from 16 to 13, a loss of 3 minnows
- Days 0 to 1: the school line falls from 20 to 19, a loss of 1 minnow
Kira reads the graph. Which statement is right about adding minnows to a group?
- Survival rises 20 points between 10 and 20 minnows, so doubling the group doubles how many survive
- Survival keeps rising, but each added minnow helps less: 10 points from 5 to 10, 4 from 15 to 20
- Survival will reach 100% in a big enough group, so a group has no cost
- Survival rises by the same amount for each minnow added
Luz reads the model graph of huddled birds that touch their neighbors. A bird alone loses 100 units. Which reason best fits the graph?
- Huddling helps the birds find food, so they lose less heat
- Each bird makes more heat when more birds crowd in, so the loss keeps falling at the same rate
- The birds in the middle save heat; the edge birds still lose 100 units
- Touching birds expose less body surface to the cold, and each added bird saves less
Waggle dance card (model data)
dance waggle run (s) angle clockwise from vertical (°) sun's compass bearing (°) dance 1 2.0 40 180 Milo uses the model rule: bearing to the resource = sun's bearing + dance angle; 1 s of run = 400 m. Where do nestmates fly?
- Bearing 140°, about 800 m
- Bearing 2°, about 16,000 m
- Bearing 220°, about 800 m
- Bearing 40°, about 800 m
Two waggle dances (model data)
dance waggle run (s) angle clockwise from vertical (°) dance P 1.0 70 dance Q 3.0 70 Noah reads two dances from one hive at the same time. Distance grows in proportion to run length. Which statement does the card support?
- Same direction; Q's place is three times as far as P's
- Same distance; Q's place lies in a different direction
- Different kinds of resource, since the runs differ
- Same direction; Q's place is two times as far as P's
Waggle dance card (1 s of run = 400 m; a bee flies 8 m each second) (model data)
dance waggle run (s) dance 3 2.5 Pia decodes the dance. About how long does the one-way flight to the resource take?
- About 250 s: 2,000 m for the round trip ÷ 8
- About 125 s: 2.5 × 400 = 1,000 m, and 1,000 ÷ 8 = 125
- About 2.5 s, the same number as the run
- About 8,000 s: 1,000 m × 8 m each second
Use the table
Emperor penguin huddles in the Antarctic winter (data: Gilbert et al. 2006)
measure value average outside temperature −17 °C temperature the birds felt in huddles above 0 °C warmest temperature in a huddle 37.5 °C penguins fitted with data loggers 8 Ren reads the table. By at least how much did huddling raise the temperature the birds felt?
- About 54.5 °C, from −17 °C to 37.5 °C
- 37.5 °C, the warmest huddle reading
- More than 17 °C, from −17 °C to above 0 °C
- Less than 17 °C, since the outside air was already cold
Zee reads the table. Which claim about who got warm does the table support?
- Huddles stayed above 20 °C for all of the huddling time
- Only the birds in the middle got warm
- Every bird had equal access to warmth, though huddles were uneven
- Huddling helped the birds find food in winter